| |
 |
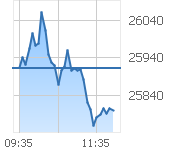
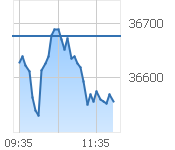
Hang Seng Index |
25465.60 |
-251.16 |
-0.98% |
18.848B |
246.542B |
|
| |
|
 |
|
Previous Closing Price |
25716.76 |
|
Day Open |
25583.55 |
|
Turnover |
246.542B |
|
| |
Day High |
25697.17 |
|
Day Low |
25419.87 |
|
Volume |
18.848B |
|
| |
One Month |
-1101.52 (-4.15%)
|
24906.00 / 27156.28 |
| |
Two Months |
-1382.87 (-5.15%)
|
24906.00 / 28056.10 |
| Last: 25465.60 |
|
Three Months |
-511.19 (-1.97%)
|
24906.00 / 28056.10 |
|
-251.16 (-0.98%)
|
|
52 Weeks |
+2002.95 (+8.54%)
|
19260.21 / 28056.10 |
|
|
| |
|
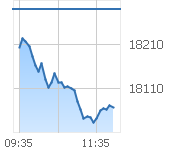
China Enterprises |
8671.48 |
-28.07 |
-0.32% |
2.423B |
66.527B |
|
| |
|
 |
|
Previous Closing Price |
8699.55 |
|
Day Open |
8670.94 |
|
Turnover |
66.527B |
|
| |
Day High |
8730.07 |
|
Day Low |
8640.48 |
|
Volume |
2.423B |
|
| |
One Month |
-361.23 (-4.00%)
|
8364.58 / 9235.68 |
| |
Two Months |
-613.93 (-6.61%)
|
8364.58 / 9585.82 |
| Last: 8671.48 |
|
Three Months |
-407.87 (-4.49%)
|
8364.58 / 9585.82 |
|
-28.07 (-0.32%)
|
|
52 Weeks |
+30.87 (+0.36%)
|
7100.61 / 9770.21 |
|
|
| |
|
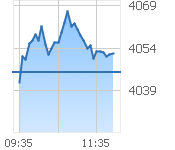
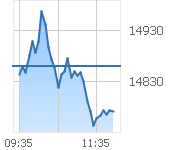
China-Affiliated Corps |
4329.75 |
-19.57 |
-0.45% |
595.554M |
10.896B |
|
| |
|
 |
|
Previous Closing Price |
4349.32 |
|
Day Open |
4340.65 |
|
Turnover |
10.896B |
|
| |
Day High |
4358.84 |
|
Day Low |
4310.55 |
|
Volume |
595.554M |
|
| |
One Month |
-8.59 (-0.20%)
|
4240.23 / 4511.88 |
| |
Two Months |
+183.58 (+4.43%)
|
4107.81 / 4511.88 |
| Last: 4329.75 |
|
Three Months |
+179.35 (+4.32%)
|
4006.18 / 4511.88 |
|
-19.57 (-0.45%)
|
|
52 Weeks |
+461.26 (+11.92%)
|
3423.82 / 4511.88 |
|
|
| |
|
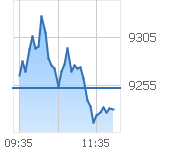
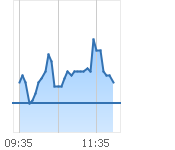
HSI Finance |
49243.47 |
-1001.31 |
-1.99% |
677.926M |
14.610B |
|
| |
|
 |
|
Previous Closing Price |
50244.78 |
|
Day Open |
49681.00 |
|
Turnover |
14.610B |
|
| |
Day High |
49876.24 |
|
Day Low |
49222.48 |
|
Volume |
677.926M |
|
| |
One Month |
-2251.93 (-4.37%)
|
49143.58 / 53986.18 |
| |
Two Months |
-1516.81 (-2.99%)
|
49143.58 / 54055.53 |
| Last: 49243.47 |
|
Three Months |
+1301.76 (+2.72%)
|
47133.22 / 54055.53 |
|
-1001.31 (-1.99%)
|
|
52 Weeks |
+10484.52 (+27.05%)
|
32939.00 / 54055.53 |
|
|
| |
|
HSI Utilities |
40690.72 |
-4.34 |
-0.01% |
48.522M |
1.106B |
|
| |
|
 |
|
Previous Closing Price |
40695.06 |
|
Day Open |
40784.73 |
|
Turnover |
1.106B |
|
| |
Day High |
41024.26 |
|
Day Low |
40618.87 |
|
Volume |
48.522M |
|
| |
One Month |
-517.35 (-1.26%)
|
40227.39 / 41657.84 |
| |
Two Months |
+1707.69 (+4.38%)
|
38550.11 / 41657.84 |
| Last: 40690.72 |
|
Three Months |
+2790.72 (+7.36%)
|
37320.04 / 41657.84 |
|
-4.34 (-0.01%)
|
|
52 Weeks |
+5673.26 (+16.20%)
|
33122.23 / 41657.84 |
|
|
| |
|
HSI Properties |
20254.13 |
-262.51 |
-1.28% |
76.324M |
3.134B |
|
| |
|
 |
|
Previous Closing Price |
20516.64 |
|
Day Open |
20448.07 |
|
Turnover |
3.134B |
|
| |
Day High |
20527.27 |
|
Day Low |
20178.89 |
|
Volume |
76.324M |
|
| |
One Month |
-839.34 (-3.98%)
|
20317.66 / 22271.11 |
| |
Two Months |
+1393.13 (+7.39%)
|
18658.71 / 22271.11 |
| Last: 20254.13 |
|
Three Months |
+2112.92 (+11.65%)
|
17418.59 / 22271.11 |
|
-262.51 (-1.28%)
|
|
52 Weeks |
+4230.75 (+26.40%)
|
13923.78 / 22271.11 |
|
|
| |
|
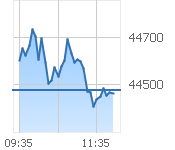
HSI Commerce & Industry |
13482.93 |
-62.81 |
-0.46% |
1.972B |
66.694B |
|
| |
|
 |
|
Previous Closing Price |
13545.74 |
|
Day Open |
13512.52 |
|
Turnover |
66.694B |
|
| |
Day High |
13613.37 |
|
Day Low |
13445.44 |
|
Volume |
1.972B |
|
| |
One Month |
-613.59 (-4.35%)
|
12980.54 / 14376.09 |
| |
Two Months |
-1126.04 (-7.71%)
|
12980.54 / 15071.24 |
| Last: 13482.93 |
|
Three Months |
-843.30 (-5.89%)
|
12980.54 / 15071.24 |
|
-62.81 (-0.46%)
|
|
52 Weeks |
-258.65 (-1.88%)
|
10949.18 / 16080.32 |
|
|
| |
|
S&P/HKEx GEM |
20.14 |
+0.05 |
+0.25% |
298.365M |
124.389M |
|
| |
|
 |
|
Previous Closing Price |
20.09 |
|
Day Open |
20.05 |
|
Turnover |
124.389M |
|
| |
Day High |
20.29 |
|
Day Low |
19.97 |
|
Volume |
298.365M |
|
| |
One Month |
+0.27 (+1.36%)
|
19.62 / 21.03 |
| |
Two Months |
-0.05 (-0.25%)
|
19.38 / 21.11 |
| Last: 20.14 |
|
Three Months |
+0.71 (+3.65%)
|
18.88 / 21.11 |
|
+0.05 (+0.25%)
|
|
52 Weeks |
+2.55 (+14.50%)
|
15.14 / 22.09 |
|
|
| |
|
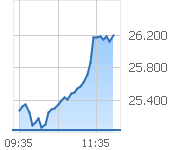
HSI Volatility Index |
26.42 |
+0.86 |
+3.37% |
0 |
0 |
|
| |
|
 |
|
Previous Closing Price |
25.56 |
|
Day Open |
24.46 |
|
Turnover |
0 |
|
| |
Day High |
26.51 |
|
Day Low |
24.46 |
|
Volume |
0 |
|
| |
One Month |
+3.14 (+13.49%)
|
21.69 / 33.15 |
| |
Two Months |
+5.02 (+23.46%)
|
19.33 / 33.15 |
| Last: 26.42 |
|
Three Months |
+9.14 (+52.89%)
|
16.35 / 33.15 |
|
+0.86 (+3.37%)
|
|
52 Weeks |
+0.30 (+1.15%)
|
16.35 / 47.99 |
|
|
 Disclaimer